Question: What does "Gantt chart" represent in project management?
Answer:
A Gantt chart is a timeline that shows project tasks and their durations, helping project managers visualize and plan project schedules.
MCQ: What does "Gantt chart" represent in project management?
Explanation:
A Gantt chart is a timeline that shows project tasks and their durations, helping project managers visualize and plan project schedules.
Discuss a Question
Related Questions
- 1. In project management, what is the purpose of a "stakeholder analysis"?
- 2. What is the key advantage of using a project management methodology like Agile in web development?
- 3. What is the primary role of a project manager in web project development?
- 4. What is the purpose of a project scope statement in web project management?
- 5. What does "PMBOK" stand for in the context of project management?
- 6. What is the primary purpose of a project kickoff meeting in web development?
- 7. In web project management, what does "scope creep" refer to?
- 8. What is the primary purpose of a project change control process in web development?
- 9. What is the key role of a project charter in web project management?
- 10. What does "ROI" stand for in project management?
You may be interested in:
Web Fundamental MCQsRecently Added Articles

The Importance of Ensuring a Seamless Global Experience for Your Software Applications
Last updated on: June 17, 2025Posted by: ExamRadar
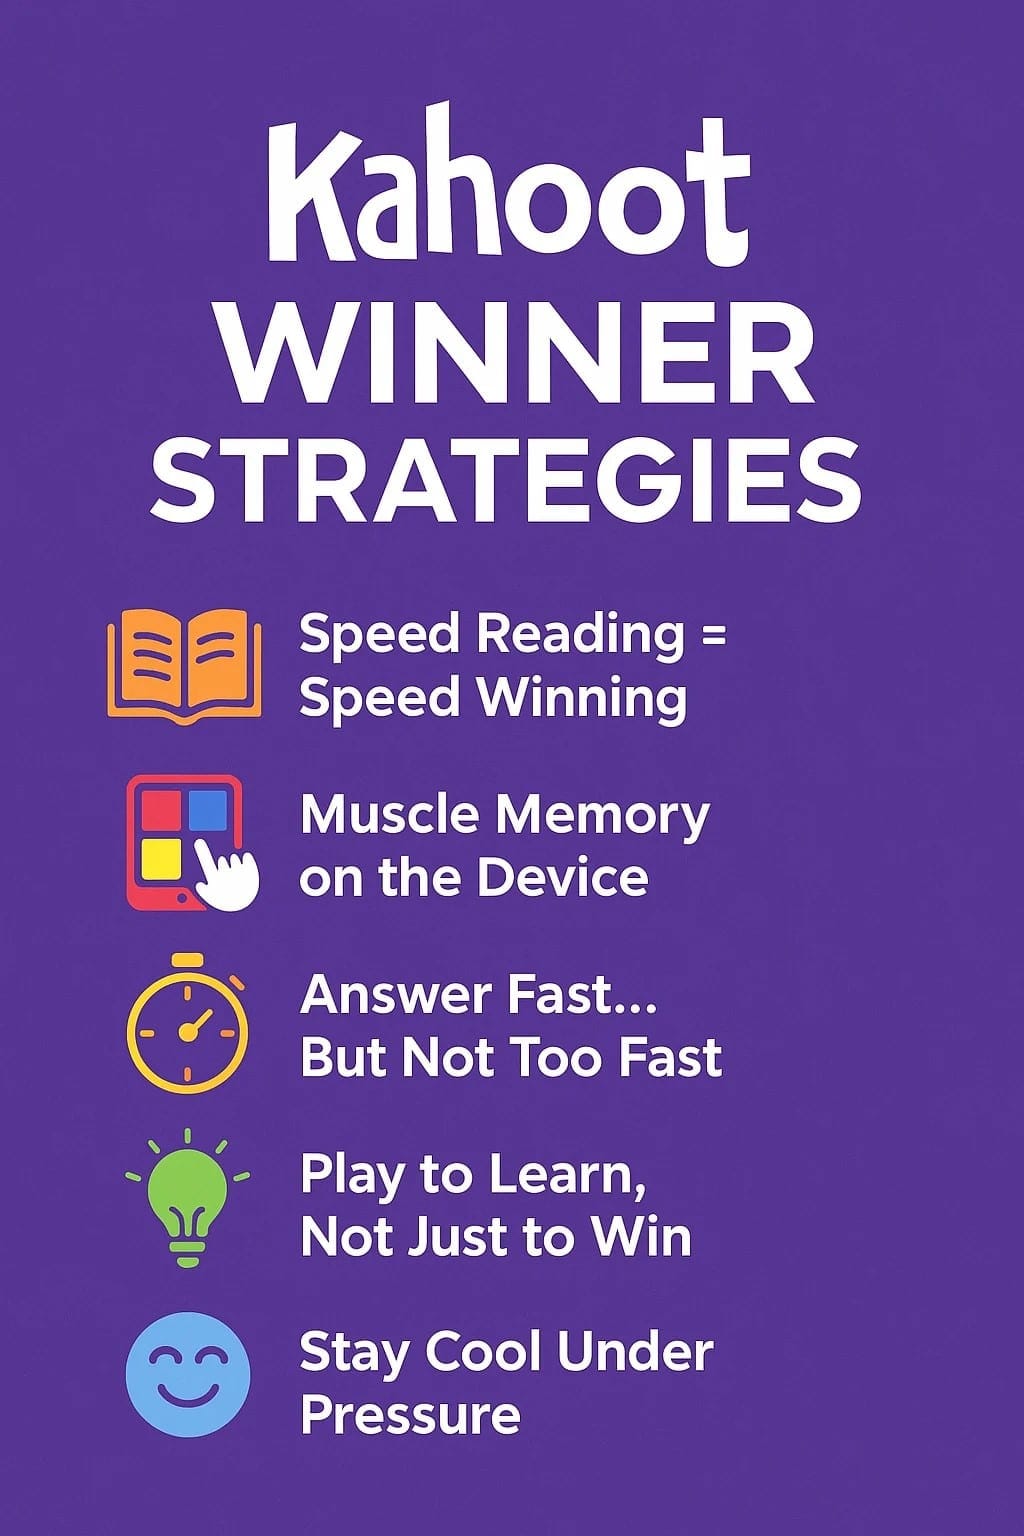
Top 5 Kahoot Winner Strategies Students Are Using Right Now
Last updated on: May 14, 2025Posted by: ExamRadar

Daily Routine to Cover the RBI Grade B Syllabus Fast
Last updated on: May 14, 2025Posted by: ExamRadar

How Can AI Simplify the Academic Life of Students?
Last updated on: April 16, 2025Posted by: ExamRadar

Want to Clear IBPS RRB PO? Master These Mock Test Hacks!
Last updated on: March 10, 2025Posted by: ExamRadar

Top AI Tools for Instantly Detecting Plagiarized Writing
Last updated on: December 5, 2024Posted by: ExamRadar

Applying Algorithmic Trading Techniques to Forex: Insights for Programmers and Data Scientists
Last updated on: November 22, 2024Posted by: ExamRadar